;)
This blog post will show how to create a custom alert format using a combination of Kusto and Azure Automation. This process is being used to overcome a current inability to generate custom alert formats discussed in the previous blog post of this series. I previously blogged on this topic but the solution has evolved significantly since then.
The solution we are using is built from four pieces: a custom Kusto query, alert notification, Azure Automation, and LogicApps or Azure Automation with SendGrid.
This issue is discussed online here: Configure Email Template for Azure Alerts – Stack Overflow and here can we customize the body content of the Azure alert Emails from code ? – Microsoft Q&A
The previous resolution was that we provided is available here. The previous version of this will not work as Microsoft has changed the format of alert content using the “common alert schema”.
What is the benefit of customizing Azure Alerts?
In the previous blog post, I explained that the default alerting in Azure is great for integration into ticketing systems but is not very human-readable due to the amount of information in the alert (on average 3-4 pages). Through custom alert formatting, we can create an alert with only the required information such as the one below.
Figure 1: Simplified email alert
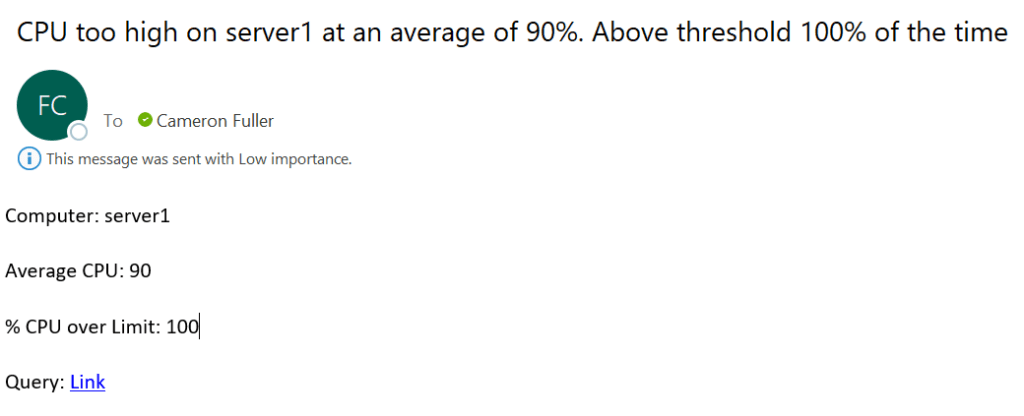
The subject itself lets you know pretty much everything you need to know: The CPU on a specific server is too high (90% in this example), and its consistently too high (100% of the time). The message contents include the same information in separate easy to read fields, and provides a link to the query to get more information. This approach also lets you fully control how you want your alerts to be formatted so you can add, remove or change anything included in the email.
How does this solution work?
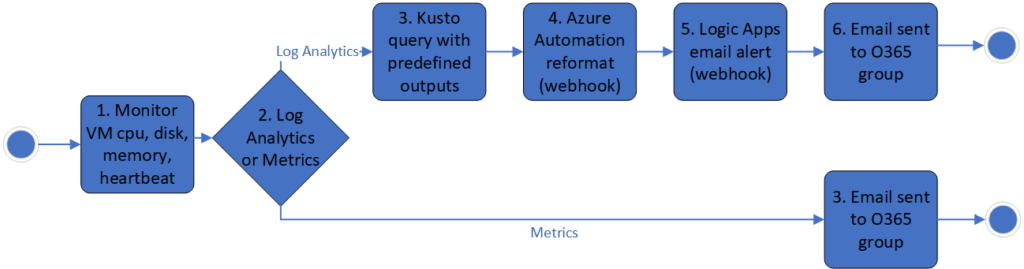
The full process we are using is shown below in Figure 2.
Figure 2: Process flow for log analytics and metric based alerts.
Part 1: The Kusto query
The first part of this solution requires the creation of a Kusto query that not only identifies the condition we are looking for, it also provides the key pieces required to effectively format the alert.
In the sample query below, we define the threshold we are looking for (the CPUPercentage metric needs to be between 90-100% and it needs to be above that timeframe at least 90% of the time). This makes the alert much more actionable as it is indicating a consistently high CPU utilization, not a short spike of CPU utilization. We also use this query to develop a set of fields that will later be used to format the alert. Specifically: NotificationEmail, Subject and Body. Every alert sent via this solution must have these fields defined.
let CounterThresholdMax = 100;

let CounterThresholdMin = 90;

let CounterThresholdPct = 90;

let NotificationEmail = <emailaddress>;

AzureMetrics

| where ResourceProvider == "MICROSOFT.WEB" and MetricName == "CpuPercentage"

| summarize

    Avg = avg(Average),

    OverLimit = countif(Average >= CounterThresholdMin and Average <= CounterThresholdMax),

    PerfInstanceCount = count(Resource),

    PctOver = round(todouble(todouble(((countif(Average >= CounterThresholdMin and Average <= CounterThresholdMax) * 100)) / todouble((count(Resource))))))

    by Resource

| where PctOver > CounterThresholdPct

| extend Subject = strcat("CPU too high on ", Resource, " at an average of ", toint(Avg), "%. Above threshold ", toint(PctOver), "% of the time")

| extend Body = strcat(@"<p>Resource: ", Resource, "</p>", "<p>Average CPU: ", toint(Avg), "</p>", "<p>% CPU over Limit: ", toint(PctOver), "</p>")

| extend NotificationEmail = NotificationEmail
Part 2: Configuring alert notification
The alert needs to be configured in the following ways:
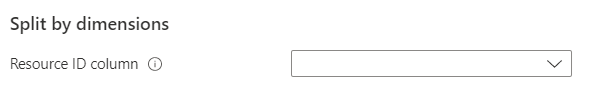
- Do not use split by dimensions. Split by dimensions It does not use split by dimensions (see Figure 3).
Figure 3: Not splitting by dimensions
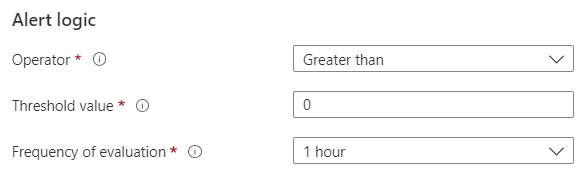
- The alert logic has a threshold value of greater than 0 (see Figure 4).
Figure 4: Alert logic
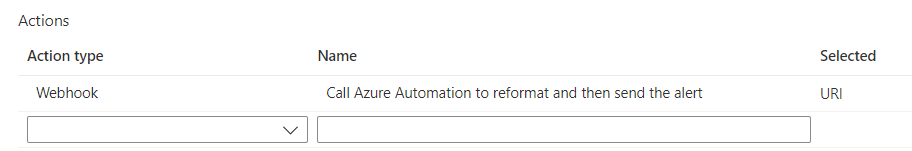
- The action group which is used contains a webhook that calls the alert processing runbook in Azure Automation (see Figure 5).
Figure 5: Webhook call to runbook
Part 3: Receiving the alert and processing it (Azure Automation)
This step is accomplished via a PowerShell runbook running in Azure Automation. It is called by the webhook configured in the notification group. Details on this script will be provided in the next post in this blog series.
Part 4: Sending the alert (LogicApps or Azure Automation with SendGrid)
This step is accomplished via a LogicApp or using Azure Automation integrated with SendGrid. The details on the LogicApps option will be provided two posts later in this blog series.
Summary: If you need custom formatted alerts, this is the best method we have found to date. In the next blog post we will showcase the updated Azure Automation runbook designed to receive and process the alert.