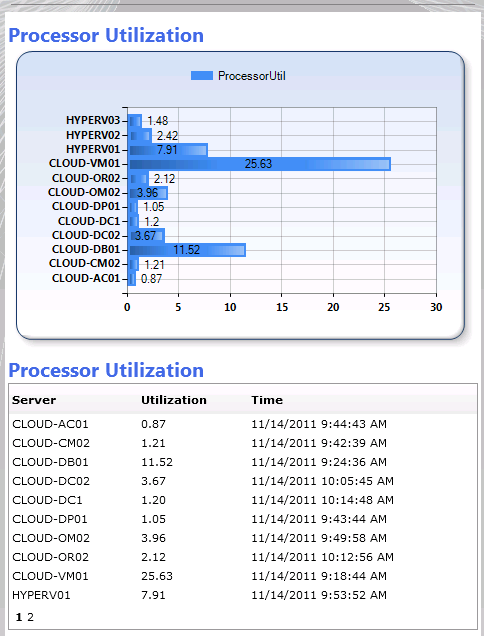
The following is another dashboard component for the Service Manager Dashboard customized for OpsMgr (#SCOM). This queries for from the OperationsManagerDW database to gather the most recent counters for Processor Utilization for all servers in the environment. This query has been added to the SQL queries provided on SystemCenterCentral (and remember I am not a SQL guy so if the query is ugly don’t blame me!)
All Server processor utilization most recent counter: (displayed as a bar chart and data grid)

DECLARE @HOURsOffset NUMERIC
DECLARE @ObjectName varchar(200)
DECLARE @CounterName varchar(200)
DECLARE @InstanceName varchar(200)
set @ObjectName=’Processor‘
set @CounterName=’% Processor Time‘
set @InstanceName=’_Total‘
SET @HOURsOffset = (select datediff(hour,getdate(),getutcdate()) )
DECLARE @TABLE TABLE ([NAME] VARCHAR(255),[SampleValue] NUMERIC(9,2),[TimeAdded] DATETIME, [Rank] INT)
INSERT INTO @TABLE
SELECT left(Path,CHARINDEX(‘.’, Path)-1) as Path, SampleValue, dateadd(HOUR,-@HOURsOffset,DateTime) AS TimeAdded,
rank() OVER (PARTITION BY Path ORDER BY DateTime DESC) AS Rank
FROM Perf.vPerfRaw p
INNER JOIN vManagedEntity me ON me.ManagedEntityRowID = p.ManagedEntityRowID
INNER JOIN vPerformanceRuleInstance pri ON pri.PerformanceRuleInstanceRowId = p.PerformanceRuleInstanceRowId
INNER JOIN vPerformanceRule pr ON pr.RuleRowId = pri.RuleRowId
where objectname = @ObjectName and instancename = @InstanceName and countername = @CounterName and Path != ‘NULL’
and p.DateTime > DATEADD(minute, -60, getutcdate())
SELECT DISTINCT (NAME)as PATH,SampleValue as ProcessorUtil, TimeAdded FROM @TABLE
WHERE rank = 1
order by [Path], [TimeAdded]
Note: By changing the bolded items above, this SQL query could be used to to provide any other performance counter which is gathered by Operations Manager.
Additional Note: Performance counters which use optimized data can cause challenges as they often will not have reported the value within the timeframe identified above (-60 in the query indicates the number of minutes to look back for data).
Summary: Looking for a dashboard to show the most recent value for a performance counter in OperationsManager using the OperationsManagerDW? Check this one out!

;)


