;)
One of the best parts of TechEd was getting to talk with customers who are using Operations Manager and had a specific question that they were looking for a resolution to. One of these conversations I had revolved around monitoring of processes in Operations Manager. The question was posed if it’s possible to monitor all processes running on a system and their memory and processor impacts. The discussion worked through various ways that Operations Manager could assist with this requirement.
- Monitoring individual process with the Process Monitoring Management Pack Template – this template can be used to monitor a specific process and can alert based upon high memory or processor utilization. Unfortunately for this client it is a specific process name instead of all processes that run on a system.
- We discussed that Operations Manager can gather any performance counters via a rule and can use a monitor to alert when thresholds are exceeded. So an option would be a rule to gather all of the processes and their memory usage as well as their processor usage. And a monitor could be established which alerts when certain boundaries are crossed. This unfortunately would results in the gathering of a large number of performance counters and a large number of monitors to keep track of each of these individual processes.
- My recommendation was to focus on the health of the entire Operating System and instead alert via diagnostics when memory and processor thresholds are exceeded for the system. This way, individual memory and processor thresholds do not need to be established on a per-process level but rather we monitor the full Operating System and provide a diagnostic which indicates when thresholds have been crossed indicating what process caused that threshold to be crossed.
CPU utilization and diagnostics:
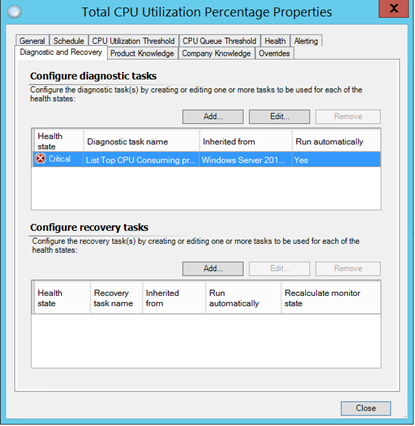
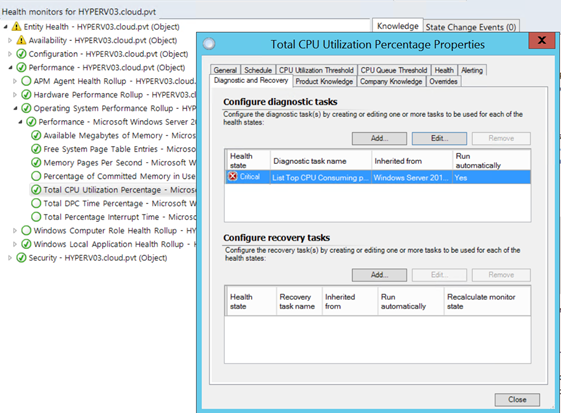
A good example of this is the Total CPU Utilization Percentage monitor in the Windows Server 2012 management pack. The Windows 2012 management pack monitor automatically runs a diagnostic which lists the top CPU consuming processes which occurred to cause the threshold to be crossed.
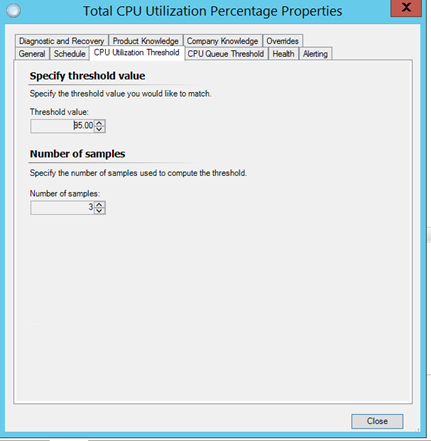
So when the thresholds are crossed: (95% CPU utilization over 3 samples)
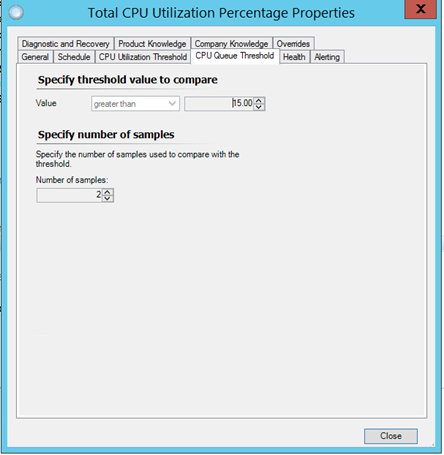
And a CPU queue of > 15 for 2 samples.
The diagnostic reports what caused the high CPU usage on the system. The Windows 2012 management pack has this diagnostic enabled by default.
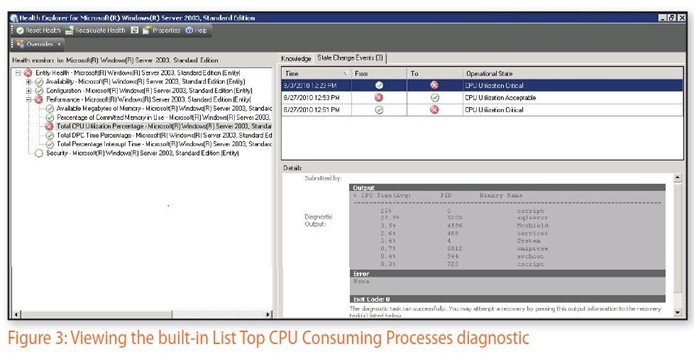
An example of this is available in the Windows IT Pro article on Operations Manager and KPI’s available at: http://windowsitpro.com/operations-manager/operations-manager-key-performance-indicators. The graphic below is from that article and shows this monitor for a Windows 2003 system.
Memory utilization and diagnostics:
Operations Manager also monitors the memory available on the system with the Available Megabytes of Memory monitor shown below.
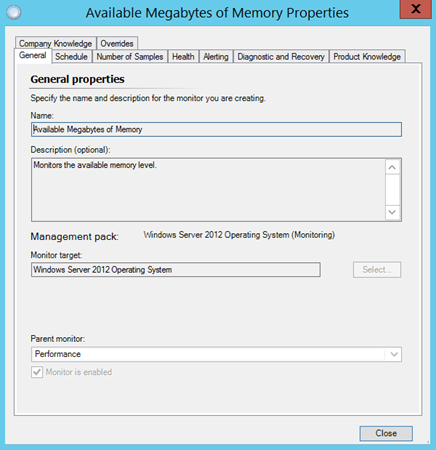
A similar type of diagnostic could be added to the Available Megabytes of Memory monitor shown below which could report on what processes caused the memory to reach a critical state.
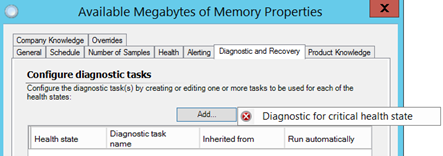
A starting point for this could be done by using the sample script on SystemCenterCentral.
Using dashboards to identify critical systems:
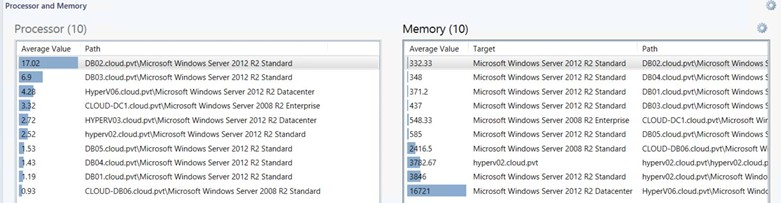
To quickly identify systems which are experiencing potential bottlenecks, try an Operations Manager 2012 style dashboard which uses the Performance by Object widget to display the highest CPU utilization and lowest memory utilization as shown below.
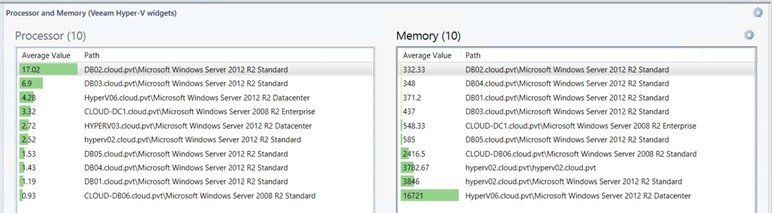
The graphic below shows how the upcoming Veeam management pack widgets can be used to show similar information (set for threshold values for warning and critical based on the values for the counters). Note the yellow status on the memory values with less than 500 MB available.
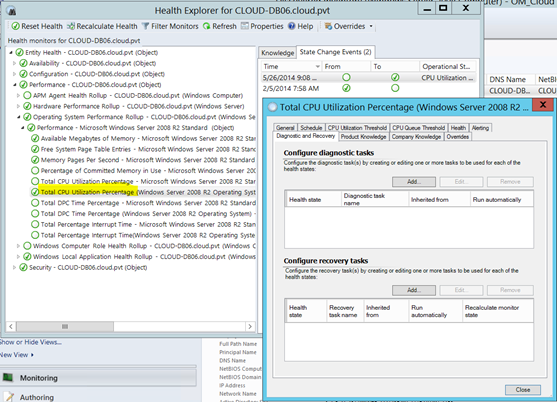
A note on the Windows 2008 management pack:
For some reason the Windows 2008 management pack has two versions of this monitor. The one which is enabled by default does NOT have this diagnostic as shown below.
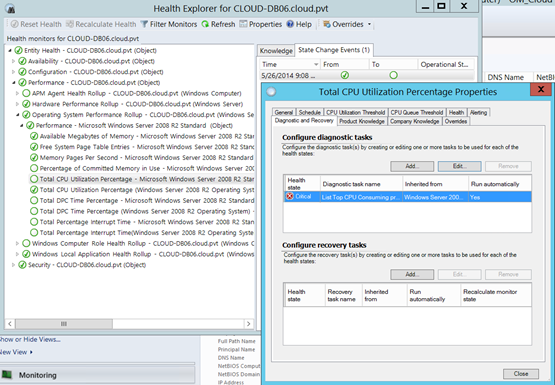
The disabled one does have the diagnostic but it is not enabled by default in the Windows 2008 management pack.
Summary: Operations Manager can use monitors and diagnostics to identify when a system has breached a threshold and to help to identify what caused the threshold to be breached. Using this approach and other approaches such as process monitors and dashboards we can provide insight into current utilization and help to track down what caused a performance issue on a system. Thank you to Doug for bringing me this excellent question at TechEd!